
Free activities › Middle school
Satellites Show a Strong El Niño Building in the Pacific
NASA says warm Pacific waters in 2026 look similar to past El Niño events that changed weather around the world.
Print it — all four files
The student packet has no answers in it. The teacher copy is the same pages plus a note on each question and the answer keys. Both languages carry the same story, the same picture and the same vocabulary.
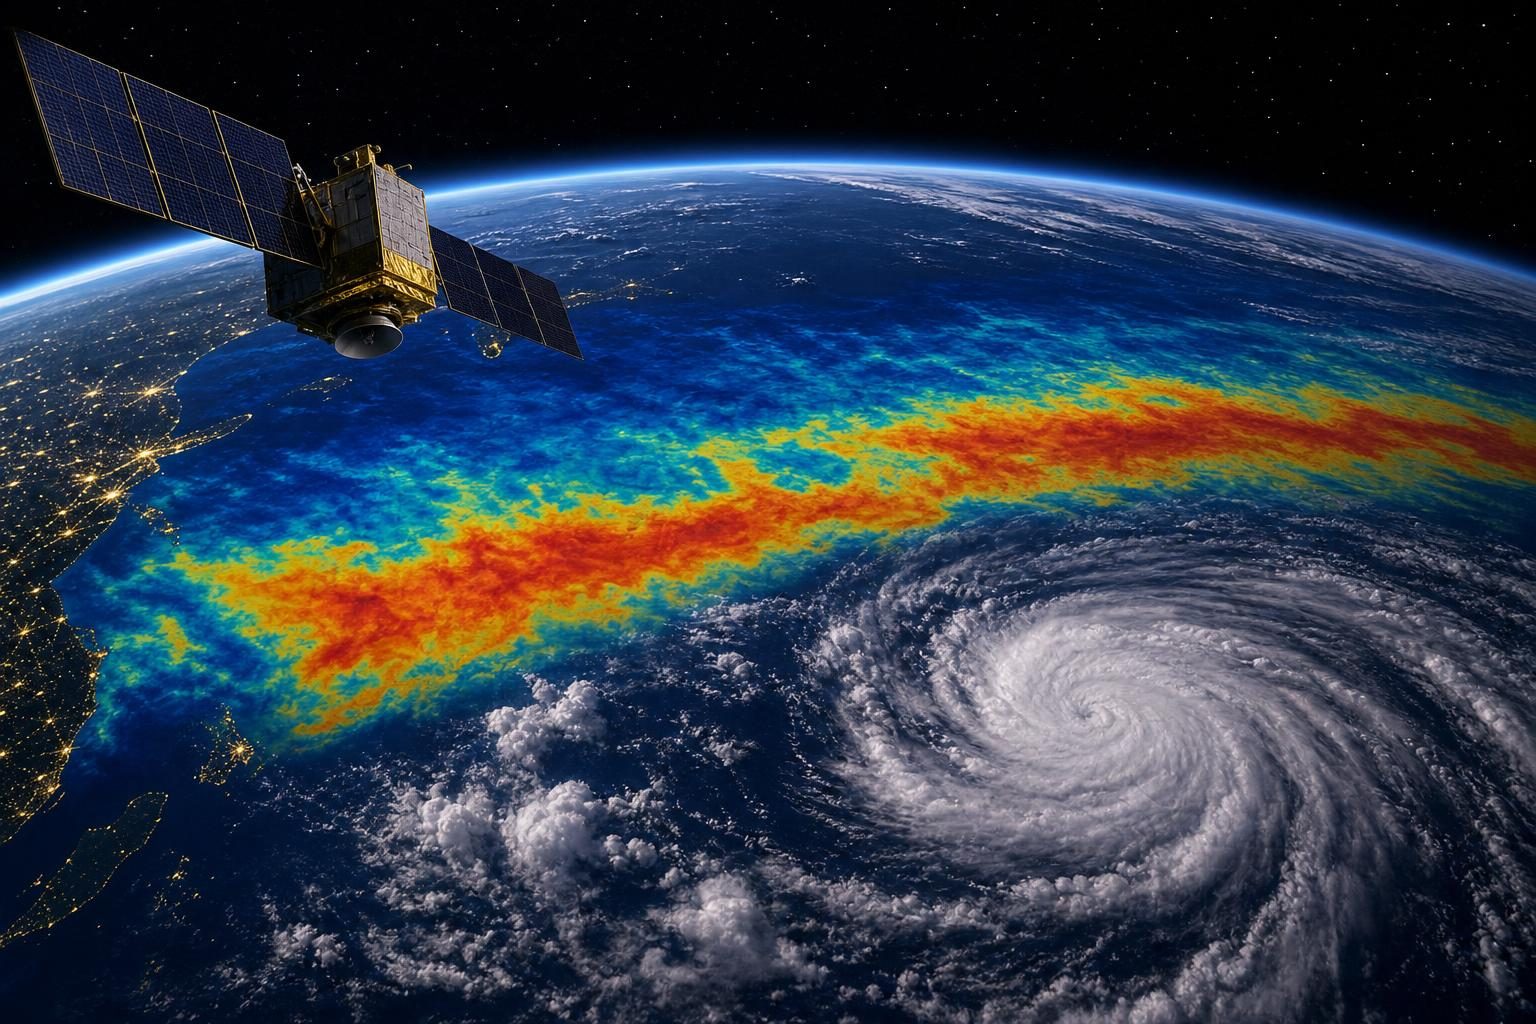
A strong El Niño is building in the Pacific Ocean, according to NASA’s Earth Observatory, and satellites are helping scientists compare it with some of the strongest El Niño events ever measured. El Niño is a natural climate pattern that happens about every two to seven years. During El Niño, water becomes warmer than usual in parts of the equatorial Pacific, the area of the ocean near Earth’s equator.
That may sound far away from a classroom in the United States. But El Niño can shift weather patterns across the planet. NASA notes that very strong El Niño events in 1997-98 and 2015-16 were linked to major effects, including fires in Indonesia and the Amazon, drought that hurt crops in southern Africa, and heavy rain and coastal flooding in Southern California. Scientists do not know yet exactly what this winter will bring, but the current event is strong enough to watch closely.
One reason scientists can study El Niño so well is that satellites measure the height of the ocean surface. This method is called satellite altimetry, which means measuring height from space. Warm water expands, so it can make the sea surface slightly higher than normal. When satellites see higher-than-average water levels in the central and eastern Pacific, that can be a sign that heat is building there.
NASA compared satellite data from October 1997 with data from October 2026. The 1997-98 El Niño was one of the strongest on record. NASA says the 2026 event came on more suddenly than the 1997 event, but by October the two looked similar in important ways. In both cases, warm, higher water stretched far across the Pacific toward South America. That matters because the location of the warm water helps shape how the atmosphere responds.
El Niño starts with a loop between the ocean and the air. Trade winds, which are steady winds near the equator, usually push warm water toward the western Pacific. That warm water piles up there, making sea level a little higher in the west than in the east. When the trade winds weaken, warm water can move east. That movement can weaken the winds even more, which lets still more warm water move east. The cycle can grow stronger over time.
Still, NASA scientists warn that no two El Niño events are exactly alike. The 2015-16 El Niño was also very strong, but it did not push warm, high water toward South America in the same way. Its rain effects were more concentrated over Central America and the southeastern United States, with serious flooding in Mexico. This is why scientists compare patterns but do not treat the past as a perfect script for the future.
The National Oceanic and Atmospheric Administration, or NOAA, said on October 8 that there was an 83 percent chance of a strong-to-very strong El Niño through the first three months of 2027. NOAA is the U.S. agency that studies oceans, weather, and the atmosphere. That forecast does not mean every place will have extreme weather. It means the ocean pattern is strong enough that it could influence weather in many regions.
This story connects to science classes in several ways. It shows how energy moves through Earth systems, how oceans and air interact, and how scientists use long-term data to compare today with the past. It also shows the limits of prediction. Satellites can measure the ocean with great care, but the atmosphere is chaotic, meaning small changes can lead to different results. The best forecast is not a promise. It is an evidence-based estimate that may help communities prepare.
Written from reporting by NASA, “El Niño Then and Now”.
Discussion questions
- When scientists say this El Niño looks similar to one from 1997, how much should communities rely on that comparison when preparing for winter weather?
- Should public officials explain forecasts mostly with percentages, past examples, or simple safety advice? Defend your choice.
- What does this story show about the strengths and limits of using satellites to understand Earth’s climate?