
Free activities › Middle school
Antarctic Sea Ice Hits a Very Low Winter High
Satellites show Antarctica’s 2026 sea ice maximum was the third lowest since records began.
Print it — all four files
The student packet has no answers in it. The teacher copy is the same pages plus a note on each question and the answer keys. Both languages carry the same story, the same picture and the same vocabulary.
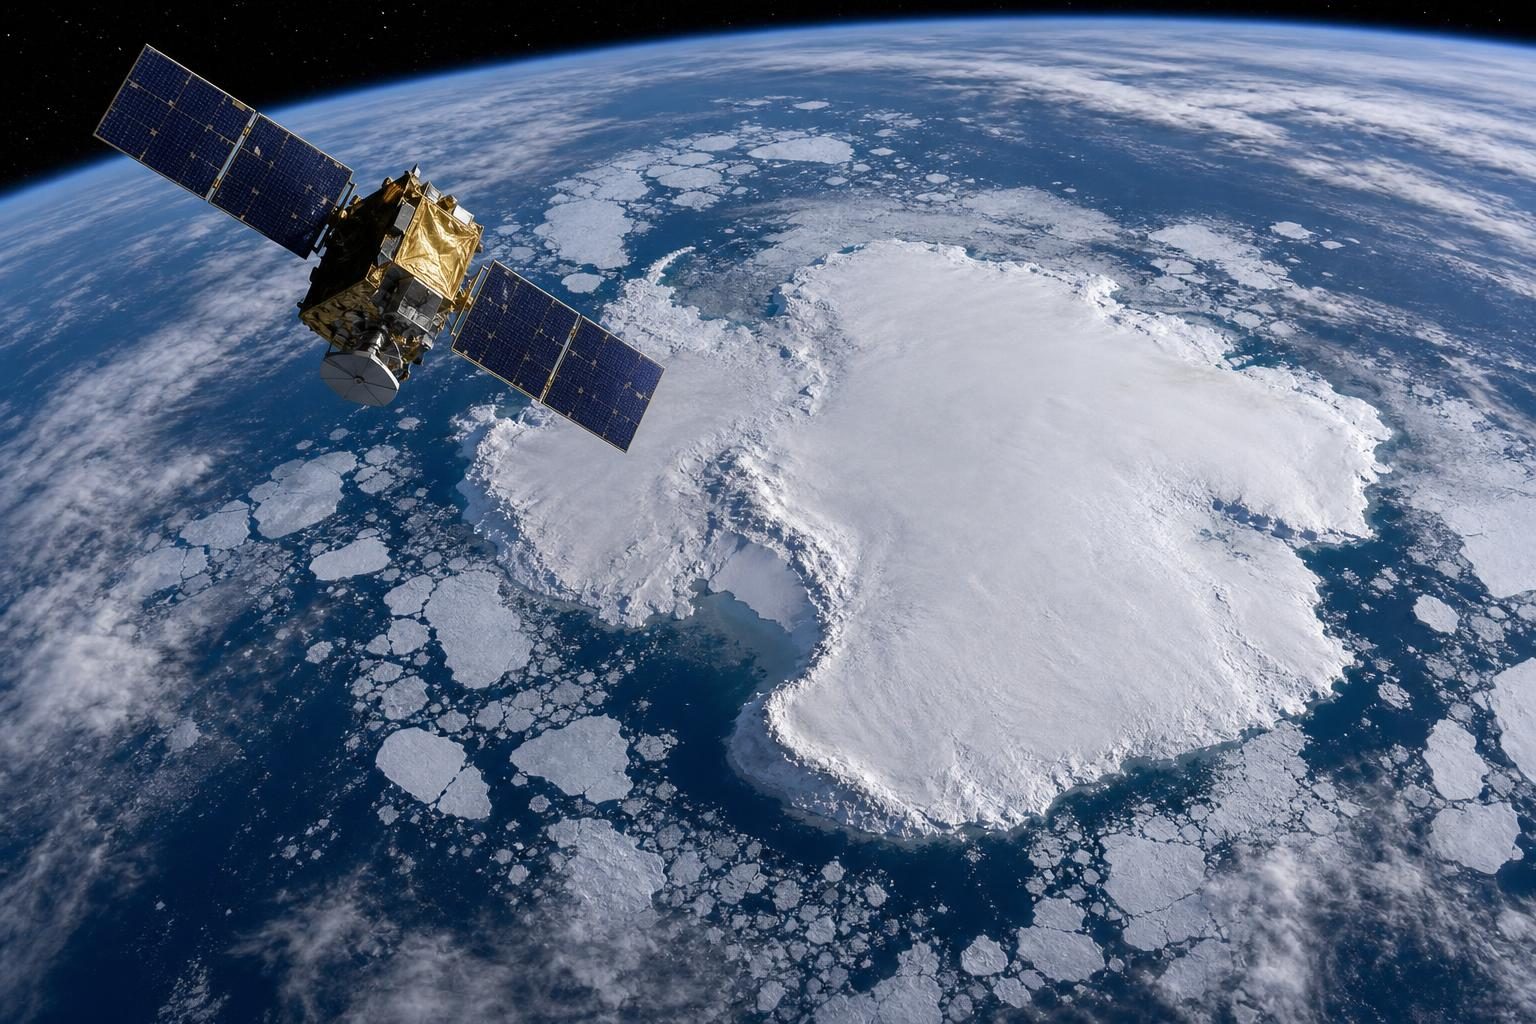
Antarctic sea ice grew to its yearly winter high in September, but that high was unusually low. According to NASA and the National Snow and Ice Data Center, the ice likely reached its 2026 maximum on September 14. It covered an estimated 17.59 million square kilometers, or 6.79 million square miles. That makes it the third-lowest maximum in the satellite record, which began in late 1978.
Sea ice is frozen ocean water. It grows and shrinks with the seasons. A maximum is the largest amount of ice measured in a year. Around Antarctica, sea ice usually reaches its maximum in September, near the end of winter in the Southern Hemisphere. It usually retreats to a minimum in February, near the end of summer there.
Antarctica is different from the Arctic. The Arctic is an ocean basin surrounded by land. Antarctica is a continent surrounded by ocean. Because of that shape, Antarctic sea ice has more room to spread out during winter. But as it spreads north, it reaches warmer water, so more of it melts in summer.
Scientists do not count every tiny patch of ice by hand. They use satellites. For this report, NASA used a measure called sea ice extent. Extent means the total area where at least 15 percent of the surface is covered by ice. That rule helps scientists compare one year with another using the same method.
The long record is important because Antarctic sea ice has not followed a simple path. From 1979 to 2014, total Antarctic sea ice increased by about 1 percent per decade. Scientists are not sure whether that increase showed a lasting change, because Antarctic sea ice can vary a lot from year to year. From 2012 to 2014, satellites even recorded new winter highs three years in a row.
Then the pattern shifted. NASA says the increase ended in 2015, and large decreases began in 2016. There have been some years with small rebounds since then, but overall Antarctic sea ice has stayed lower than normal. In 2023, satellites recorded both the lowest minimum and the lowest maximum. The 2026 maximum being the third lowest adds another year to the puzzle.
This matters in a middle school science class because it shows how scientists use evidence over time. One low year does not prove a long-term trend. One high year does not erase a decline. Scientists will keep watching to see whether the recent lower ice cover is a long-term change or a statistical fluctuation, which means a change that could happen because natural numbers rise and fall.
The tools are part of the story too. Satellites use passive microwave sensors, which measure microwave energy Earth naturally gives off. Sea ice gives off more of that energy than open water, so it stands out in the satellite images. Microwaves can pass through clouds, which lets scientists observe sea ice regularly even when the weather is cloudy or stormy.
The record has come from several satellites over time, starting with NASA’s Nimbus-7 in late 1978. Later records came from other satellites, including NASA’s Aqua satellite and, beginning in 2025, Japan’s GCOM-W satellite. The technology changes, but the question stays the same: what is happening to ice at the edge of the planet, and what can careful measurement tell us?
Written from reporting by NASA, “Antarctic Sea Ice Grows to Its 2026 Maximum”.
Discussion questions
- When scientists see several unusually low years in a row, how cautious should they be before calling it a long-term change?
- Why might Antarctica’s geography make its sea ice harder to understand than a simple “more ice” or “less ice” story?
- What are the strengths and limits of using satellites to study a place most people will never visit?